How Will Sea Levels Change in the Future?
The future rate of sea level rise is tied to choices humans make today.
Key takeaways
- Sea level will continue to rise globally well into the future if the planet continues, or further increases, warming as it is today.
- For the United States, sea level rise will likely reach around 12 inches (1 foot) by 2050. By 2100, it will likely reach between 2.3 feet and 4 feet, but higher amounts are possible and depend on greenhouse gas emissions.
- Sea level rise will be higher or lower in some places due to local factors, like changes in land height and ocean currents.
- If humans were able to stop all emissions today, sea levels would still continue to rise for centuries.
Sea Level Will Continue to Rise
The global sea level is rising due to a warming planet. This warming is driven almost entirely by human activities that are generating greenhouse gas emissions.
How much sea level rises will depend on the amount of greenhouse gases added to the atmosphere moving forward. To explore the possibilities, scientists use emission scenarios. These show the possible range, from low to high, for the amount of greenhouse gases added to the atmosphere between now and 2100. The latest Intergovernmental Panel on Climate Change (IPCC) Sixth Assessment Report (AR6) from August 2021 used these emission scenarios to project sea level rise by 2100. They found that global sea levels could rise by anywhere between 0.9 to 3.3 feet (0.27 to 1.01 meters) by 2100, with even higher amounts possible depending on what happens with the ice sheets.
The 2022 Interagency Technical Report created five sea level scenarios to show different levels that sea level rise could reach in the United States. These include different levels of greenhouse gas emissions, global warming, and water added to the ocean from land ice melting. All of the scenarios had sea levels rising around 12 inches (0.3 meters) by 2050. Then, after 2050 those five scenarios diverge, with the most likely scenarios having sea levels rise from 2.3 to 4 feet (0.7 to 1.2 meters) by 2100 in the U.S. depending on greenhouse gas emissions today and in the future. Although, higher levels are possible in some locations, such as the Gulf Coast. Other factors, such as changes in land height and ocean currents, play a large role in local sea level change and will continue to do so in the future.
How are the sea level rise scenarios in the 2022 report different from the 2017 report?
The 2022 technical report presents five possible global sea level rise scenarios by 2100, ranging from Low (1 foot) to High (6.6 feet), similar to the 2017 report but excluding the Extreme scenario. The projections for 2100 remain unchanged, but updated modeling of ice sheet behavior results in less acceleration in higher scenarios until about 2050, followed by greater acceleration toward the century's end. Consequently, the near-term range of sea level rise is narrower, while the likely range for each scenario is broader compared to the 2017 report.
Scientists are continuously improving their understanding of how ice sheets and glaciers are melting. Thus, each time these values are calculated, they provide improved estimates of what could happen. If scientists find that the glaciers are melting faster than previously measured, then this will lead to a higher global sea level estimate for the future.
What Happens If We Stop Adding Greenhouse Gases?
Even if we were able to stop all greenhouse gas emissions today or sometime in the future, global sea level will continue to rise over the next few centuries. This is because Earth’s climate is very large and complex, so it takes time to respond to changes and reach a new balance. The ocean stores enormous amounts of heat and releases that heat very slowly over time.
Think of driving a car and slowly pressing the accelerator. Adding greenhouse gases to the atmosphere is like pressing the accelerator and causing the car to speed up. Taking your foot off the accelerator does not stop the car immediately—the car continues moving as it gradually slows down. Similarly, if we stopped greenhouse gas emissions today or removed some greenhouse gases from the atmosphere, Earth’s climate system would need time to adjust. As long as the planet remains warmer, land ice will continue to melt and ocean water will continue to expand, causing global sea level to rise.
Sea level snippets
- Based on current estimates, we expect to see as much or more sea level rise in the next 30 years as we have seen in the past 100 years along the U.S. coastlines.
- Regionally, projections of sea level rise can differ from one place to the next due to changes in ocean circulation, ice sheet fingerprints, and coastal vertical land motion. For example, projections of sea level rise are higher along the Gulf Coast of the U.S. due to regional subsidence.
Sea Level Projections From the IPCC 6th Assessment Report
The IPCC 6th Assessment Report (AR6) report released in 2021 summarized our latest understanding of sea level rise and produced new projections of future sea level rise. The updated IPCC AR6 sea level projections are formed by combining different projections of individual processes that cause sea level change within a consistent framework. The AR6 uses shared socioeconomic pathways (SSP) scenarios, which predict global socioeconomic changes, to model sea level rise. There are five main scenarios based on processes we understand well and two additional ones (one low and one high emissions) that include uncertain ice sheet processes. These uncertain processes involve unexpected ice-shelf disintegration in Antarctica, sudden marine ice-sheet and ice-cliff instability, and rapid changes in Greenland’s ice balance. We have limited scientific understanding of these processes, making it hard to project their impact on sea level rise. Therefore, the scenarios that include these processes are considered uncertain.
Despite the uncertainty, these processes are important for understanding the full range of possible sea level rise. The AR6 said that these high-impact processes are less likely to occur soon but could become significant by the end of the 21st century and beyond. At lower warming levels (below 2°C by 2100), these processes are not expected to significantly contribute to sea level rise until after 2100, if at all. As a result, there is less sea level rise acceleration before 2050 and the possibility of more acceleration only towards the end of the 21st century and beyond.
Sea Level Scenarios From the 2022 Interagency Technical Report
What is the difference between a "sea level projection" and a "sea level scenario"?
A "sea level projection" is a detailed estimate of how much sea levels might rise based on different levels of greenhouse gas emissions and other factors. A "sea level scenario" simplifies these projections into a few possible futures to help policymakers make decisions about coastal development and conservation.
The 2022 Interagency Technical Report uses the foundational knowledge and projections from the IPCC AR6 to develop specific sea level rise scenarios tailored for practical use in the United States. This report is produced by multiple U.S. federal agencies and aims to provide actionable information for policy-makers, planners, and stakeholders. The 2022 Interagency Technical Report adapts these projections to a more localized context, providing detailed scenarios for different regions and communities in the U.S. It includes site-specific vertical land motion and other localized factors to create relevant sea level scenarios. While the IPCC AR6 provides a global scientific foundation, the 2022 Interagency Technical Report translates this knowledge into practical scientific information for U.S. policy-makers and planners. This helps bridge the gap between global scientific assessments and local implementation needs.
Creating the Sea Level Scenarios
The five sea level scenarios are created following a specific process:
- An assessment of the projections and science contained in IPCC AR6 is used to determine a plausible range of global mean sea level rise of between 1 ft (0.3 m) and 6.6 ft (2.0 m) in 2100. The low end – 1 ft by 2100 - represents the best possible case for future sea level rise, while the high end of 6.6 ft by 2100 represents a very pessimistic case.
- The IPCC AR6 created medium confidence sea level projections for multiple SSPs. In addition, low confidence projections allowing for potential contributions from rapid ice-sheet loss processes with unknown likelihood were also created for a high and low SSP. For each SSP, an ensemble of thousands of “samples” of the trajectory of sea level rise from 2020 to 2150 was produced. These samples cover a range of possibilities, and the associated distribution of these samples for each SSP is shown graphically on the left of the schematic below.
- Five global mean sea level targets or “gates” in 2100 that span the plausible range from 1 ft (0.3 m) to 6.6 ft (2 m) are defined. The full set of samples is filtered to find the ones that fit through each of these five gates +/- 2 cm. The SSPs with the lowest emissions primarily build the lowest sea level scenarios. The SSPs with the highest emissions plus the scenario that takes into account rapid ice sheet loss primarily build the higher scenarios.
- Finally, five time-varying Sea Level Scenarios of GMSL and associated local relative sea level rise are constructed by collecting all the samples from across SSPs that fit through the defined gates. Logically, the Intermediate Low and Intermediate scenarios will include the highest number of samples, while the other sea level scenarios will have comparatively less. The individual samples of sea level projections provide important contextual information for each of the Sea Level Scenarios, carrying with them a range of warming levels and emissions pathways. While it is not possible to directly assign probabilities to each of the sea level scenarios, additional assumptions about the future (e.g. warming level) allow for the assignment of a probability of exceeding a particular Sea Level Scenario in that assumed future.
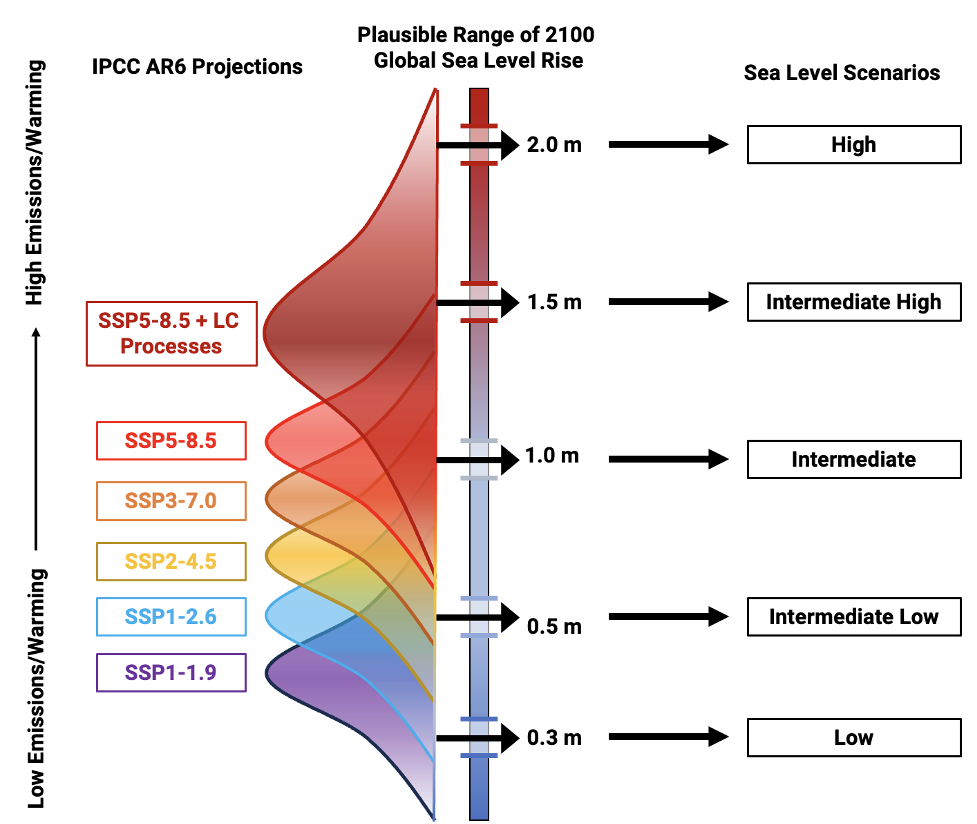
Storylines for Sea Level Scenarios
- Low (0.3 m or 1.0 ft by 2100): The target of 1 foot of increase in global sea level rise by 2100 is set under the assumption of the current rate of sea level rise continuing on into the future. This assumption is inconsistent with current observations of an acceleration in sea level rise, but could still be considered plausible under the most aggressive emission reduction scenarios. This scenario is on the lower bounding edge of plausibility given current warming and sea level trajectories.
- Intermediate Low (0.5 m or 1.6 ft by 2100): This scenario arises under a range of future emissions pathways, associated with a range of future warming levels and socioeconomic development pathways. Given current sea level observations and estimates of future warming, this scenario provides a reasonable estimate of the lower bound for the most likely sea level rise by 2100. Since low confidence processes (e.g., rapid ice sheet melt) are not important to this scenario, the range of possible sea level rise after 2100 does not expand significantly.
- Intermediate (1.0 m or 3.3 ft by 2100): This scenario is driven dominantly by high emissions scenarios, and thus higher warming levels. Projections including contributions from low confidence processes provide about 25% of the pathways for reaching the scenario target by 2100. This scenario provides a reasonable upper bound for the most likely range of sea level rise by 2100.
- Intermediate High (1.5 m or 4.9 ft by 2100): This scenario is heavily reflective of a world where rapid ice sheet loss processes are contributing to sea level rise, associated with intermediate to high future emissions, and high warming. The amount of sea level rise by 2100 corresponds to other scientific estimates of plausible high-end projections.
- High (2.0 m or 6.6 ft by 2100): This scenario only arises with high future emissions and high warming with large potential contributions from rapid ice sheet loss processes. Deep uncertainties and ambiguity embedded in this scenario frame a worst case beyond 2100 as we currently understand it, and a statement about the likelihood of reaching this scenario is not possible.
Higher Scenarios are More Likely with Higher Warming
Given that sea level rise is highly dependent on if and how fast the world’s nations reduce global emissions and mitigate warming trends, there are no probabilities that can be assigned directly to each of the Sea Level Scenarios. Instead each scenario combines information on a potential future pathway for warming levels and emissions. Possible future warming levels can be translated into the probability of exceeding a particular Sea Level Scenario in that assumed future. For higher future warming levels, it is virtually certain we will pass the Low and Intermediate Low Scenarios. On the other hand, if we keep future warming low, the likelihood of surpassing the higher scenarios is greatly reduced.
| Global Air Temperature in 2100 | Emissions Scenario | Low | Int-Low | Int | Int-High | High |
|---|---|---|---|---|---|---|
| 2.7°F (1.5°C) | Low Emissions | 92% | 37% | <1% | <1% | <1% |
| 5.4°F (3.0°C) | Intermediate to High Emissions | >99% | 82% | 5% | <1% | <1% |
| 9.0°F (5.0°C) | Very High Emissions | >99% | >99% | 23% | 2% | <1% |
| High Warming | Very High Emissions, Rapid Ice Sheet Loss | >99% | 96% | 49% | 20% | 8% |
Exceedance probabilities for the Sea Level Scenarios based on IPCC warming level–based GMSL projections. Global mean surface air temperature anomalies are projected for years 2081–2100 relative to the 1850–1900 climatology. Global surface temperatures are currently on track to reach 3.0°C above pre-industrial levels by 2100, assuming current rates of emissions-driven warming. Therefore, any temperature anomalies less than (e.g., 1.5°C) or greater than (e.g., 5.0°C) the current trajectory implies lower or greater rates of warming by 2100, respectively. As an example of how this table can be read, the third row could be used to produce the following two sentences: “Assuming 3°C of warming in 2100, there is a 5% chance of exceeding the Intermediate Scenario in 2100” and “Assuming high levels of warming in 2100 and contributions from the low confidence processes, there is a 49% chance of exceeding the Intermediate Scenario in 2100.”
Adapted from Sea Level 101 on earth.gov (U.S. Sea Level Change, a coordinated effort of NASA, NOAA and partner agencies). Figures and videos are credited in their captions.