Why is Global Sea Level Rising?
Rising global temperatures lead to sea level rise.
Key takeaways
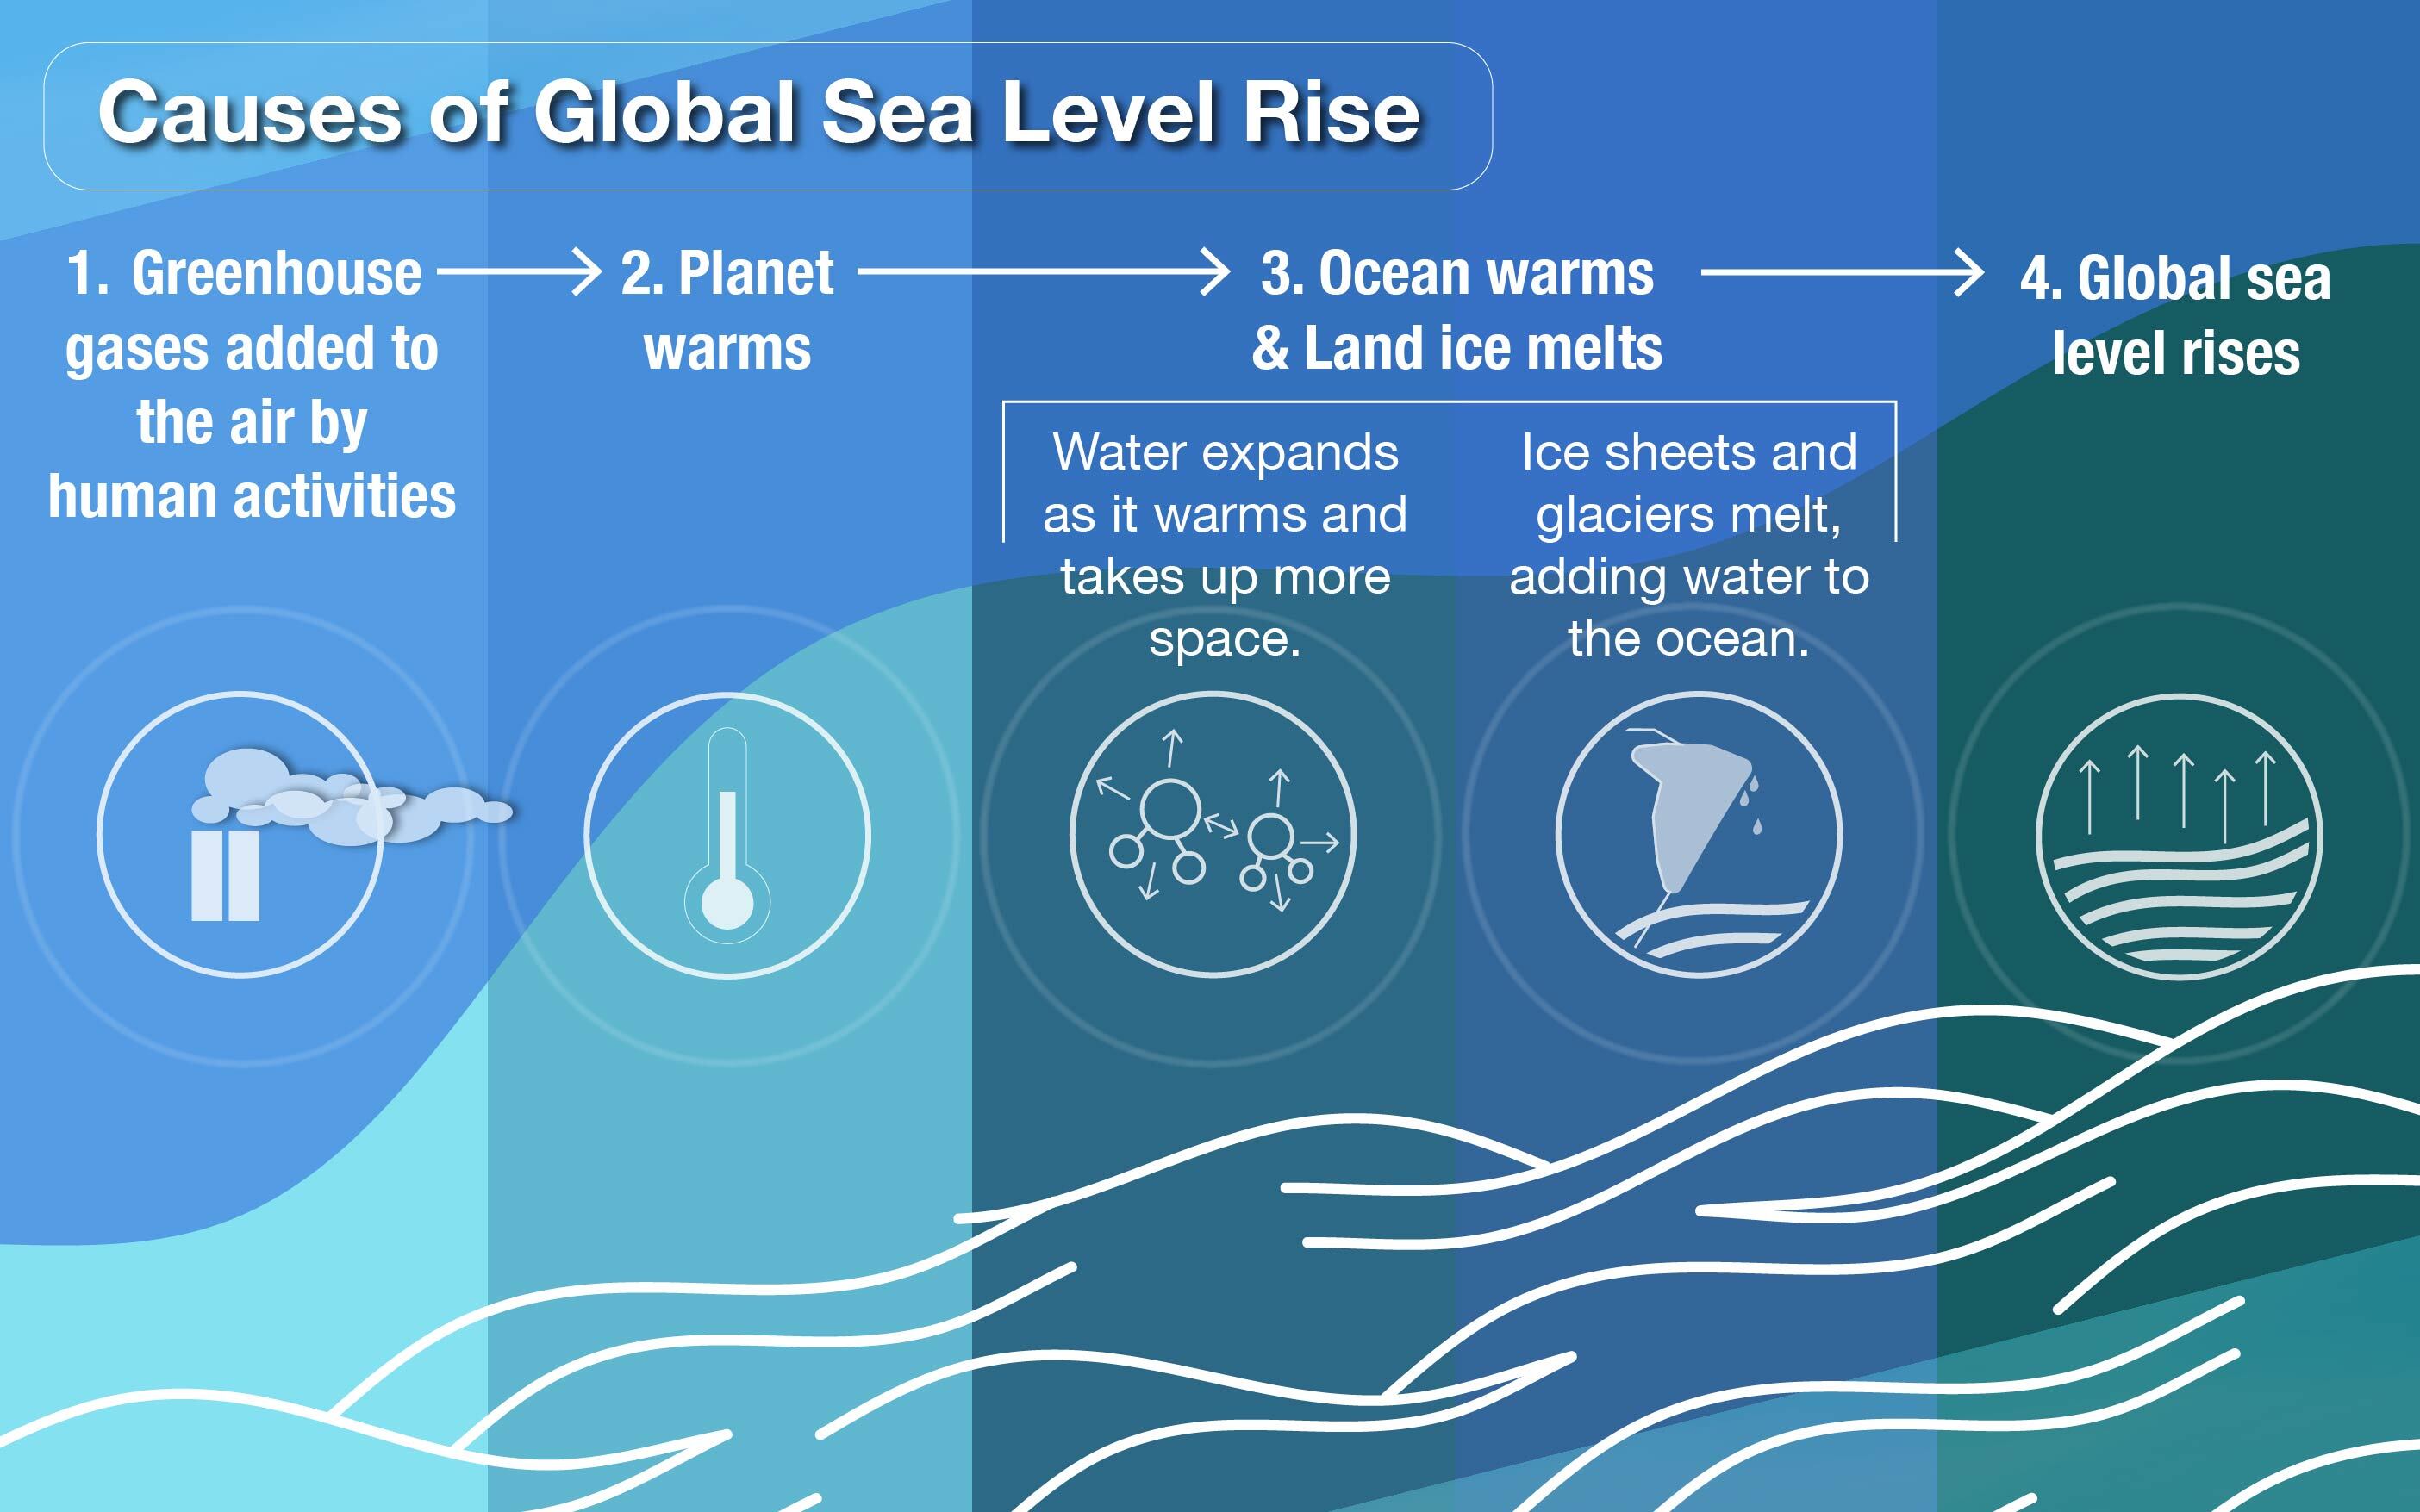
- Greenhouse gases added to the atmosphere by human activities are warming the planet.
- Global sea level is rising mainly from ocean warming and melting land ice due to climate change.
- Global sea level is rising faster today than it was 100 years ago.
Global Sea Level Rise Is Linked to Climate Change
For over 100 years, humans have burned coal, gas, and oil to produce energy. Burning these fossil fuels releases greenhouse gases into the air. Greenhouse gases warm the Earth, like a blanket wrapped around the globe. Adding more greenhouse gases thickens the blanket and the Earth becomes warmer.
What's the difference between melting sea ice and melting land ice on sea levels?
Melting sea ice doesn't raise sea levels because it's already floating in the ocean, like ice in a glass of water. However, melting land ice, such as ice in the ice sheets, adds extra water to the ocean, causing sea levels to rise.
Around 90% of this added heat is being absorbed by the ocean, warming it up. When water warms, it expands and takes up more space. This causes the water to rise along the coastline. Currently, about one third (around 33%) of global sea level rise is because of ocean warming.
The other two thirds (around 66%) of global sea level rise is because of melting land ice. As Earth heats up, it melts the land ice, including the Greenland and Antarctic Ice Sheets and other mountain glaciers. The water then flows into the ocean which raises sea levels.
Sea level snippets
- The ocean absorbs about 90% of the excess heat from global warming. To give you an idea of how much heat that is, imagine every person on Earth (around 8 billion people) using 100 hair dryers at the same time and pointing them at the ocean. That's roughly the amount of heat the ocean is absorbing every second!
- The amount of ice being lost from Greenland and Antarctic ice sheets each year is roughly equivalent to covering New York City in a layer of ice that is 1250 feet (381 meters) thick, which is about the same height as the Empire State Building.
How Do We Know Sea Levels Are Rising Faster Than They Were Before?
For decades, sea levels have been measured across the world with tide gauges and satellite altimeters. These measurements are combined to calculate the average ocean height across the world, the global sea level, each month or year. Comparing these values over time shows the amount and rate of change of global sea level.
How much has sea level risen in the past 100 years?
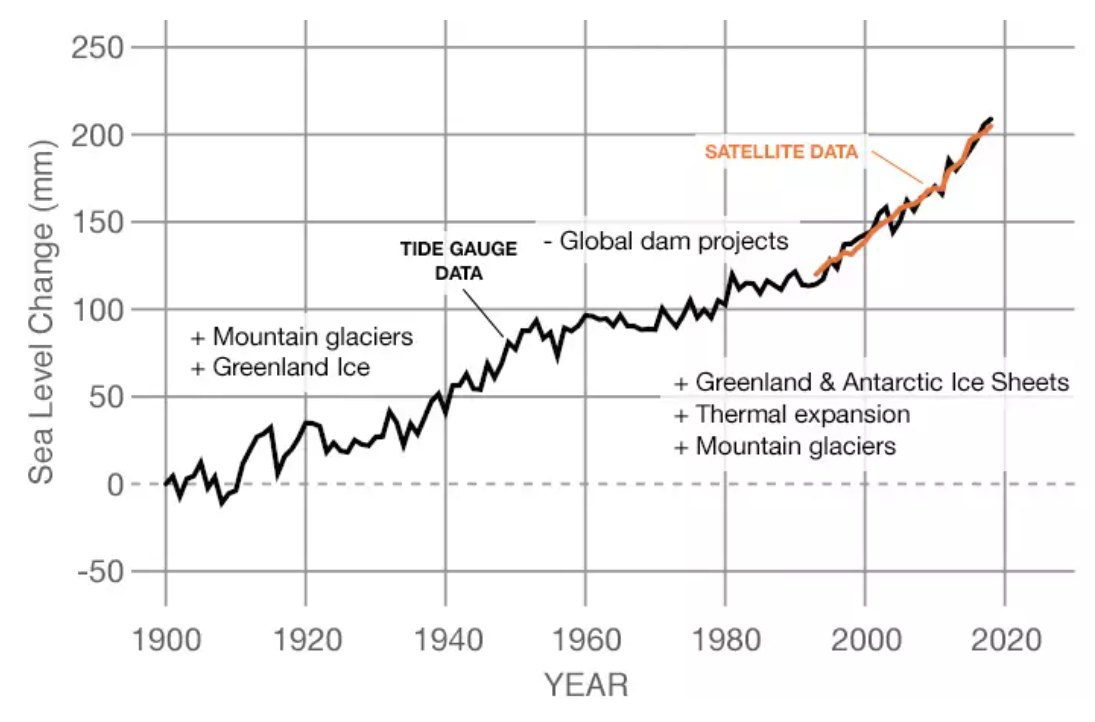
Global mean sea level, or the average height of the ocean surface, has risen 6 - 8 inches (15 - 20 centimeters) since 1920. The rate of this sea level rise is increasing.
The global sea level has been rising since the 19th century, when modern records began. And, it has been rising faster in recent years. It took 90 years (1902 – 1992) for the global sea level to rise around 4 inches. In just the last 30 years (1993 - 2023), that same amount of rise, around 4 inches, happened again.
When we plot global sea level it is not a straight line, but rather it goes up and down slightly. These movements, known as variability, show natural changes that happen due to a number of different factors. Things like tides can change sea levels over hours or days. Large climate events, like El Niño, can cause changes in sea levels over months or years. However, even though we see wiggles up and down in the global sea level, these natural changes are not large enough to offset the overall rise in global sea level we are seeing from climate change.
Why Does Global Sea Level Have Temporary Ups and Downs?
Global mean sea level is the average height of the world’s oceans. It has been steadily increasing over the past century, primarily due to two major factors: the thermal expansion of ocean water as it warms and the addition of water from melting ice sheets and glaciers. Climate change, driven by human activities that add greenhouse gases to the atmosphere, is amplifying sea level rise rates, causing it to accelerate in recent decades.
Despite this clear upward trend, global mean sea level does not increase in a perfectly linear fashion. It exhibits temporary ups and downs due to various natural phenomena and seasonal variations. One that is very noticeable is an annual cycle that results from changes that happen in our climate over the course of a year. In each hemisphere the oceans warm and expand in summer, and cool and contract in the winter. Sea levels in each hemisphere are higher in summer and early autumn, and lower in winter and early spring. In addition, there is an increase of water stored on land in the Northern Hemisphere winter and thus less in the ocean, leading to a lower global average sea level at this time of year. While these annual changes happen at different times of the year in each hemisphere, they average together to a noticeable shift in globally averaged sea level over the course of the year. In the global average, this shift is around 1 inch (2 cm) on average, although the annual cycle can be much larger in local sea levels.
At time periods slightly longer than seasons, naturally occurring climate variations can also cause changes in global mean sea level. For instance, El Niño and La Niña events can temporarily elevate or lower sea levels by affecting ocean temperatures and currents. During an El Niño event, the ocean temporarily warms on average and there is a net transfer of water from land and into the ocean due to shifting precipitation patterns. This leads to higher global mean sea level. The opposite happens during a La Niña and global mean sea level can actually drop.
We can see the interplay between long-term sea level rise, the annual cycle and El Niño by looking at satellite altimeter measurements. The animation shows the rise in global mean sea level from 1993 to 2023 based on data from a series of five international satellites. The data over the course of each year in the record is displayed. The annual up-and-down is visible - global mean sea level is a little bit higher from August to October, for example - as are the temporary spikes in sea level due to El Niño and La Niña. The spikes in sea level from 2015 to 2016 and from 2022 to 2023 result from El Niño, while the noticeable drop from 2010 to 2011 is caused by La Niña. Despite these variations, the upward trend in global mean sea level is dominant and sea levels are roughly 4 inches higher today than they were in 1993.
Short-Lived But Significant Impact of Dam Building
In the mid-20th century, the construction of large dams significantly impacted global mean sea level. These massive engineering projects, primarily aimed at water storage, flood control, and hydroelectric power generation, led to substantial alterations in the natural flow of water between ocean and land. By trapping large volumes of water in reservoirs, dams effectively reduced the amount of freshwater reaching the oceans, which suppressed global mean sea levels. This impact was particularly pronounced during the peak dam-building era from the 1950s to the 1970s. The cumulative effect of numerous dams around the world contributed to a temporary flattening of global mean sea level rise, counteracting the sea-level rise driven by ice melting and thermal expansion of seawater. Nevertheless, this was only temporary, and since around 1970, we’ve seen a sustained period of increasing global mean sea level that can be explained by the combination of thermal expansion and ice melt. Tracking the drivers of global sea level rise is critical to understanding shifts that we see and can help inform what we know about sea level changes in the future.
Adapted from Sea Level 101 on earth.gov (U.S. Sea Level Change, a coordinated effort of NASA, NOAA and partner agencies). Figures and videos are credited in their captions.