How Do We Measure Sea Level Change?
Tide gauges and satellites are key tools for understanding sea level rise.
Key takeaways
- Tide gauges have been used for centuries to measure sea level along coastlines, but they are not evenly distributed across the globe.
- Satellites have been used since 1992 to measure sea levels across the planet.
- Tracking sea level helps us know how it's changing and estimate future changes.
- Measurements show that the global sea level is rising faster over time.
Sea Levels Have Been Measured For Centuries
One of the first consistent measurements of sea level came from tide gauges. A tide gauge is a device that accurately measures the height at the surface of the water compared to the land next to it, which is known as local or relative sea level. Just like thermometers accurately measure temperatures, tide gauges provide regular measurements of ocean height for coastal communities.
Initially, tide gauges were used to measure daily changes in sea level due to tides, hence the name. Now, they have become a valuable record showing how sea levels have changed over time in a particular place. Some tide gauges have records going back over 100 years. Since the early 1800s, NOAA and its predecessor organizations have been measuring, describing and predicting tides along the coasts of the United States. The longest continuous sea level record exists for the Presidio, in San Francisco, California. Records for the area date back to June 30, 1854.
In 1992, satellites began making regular measurements of sea level from space. Satellites can make very precise measurements by using radar altimeters. A satellite altimeter works like a bat using echolocation to measure distance. The satellite sends out microwave pulses towards the ocean surface and waits for them to bounce back. By measuring the time it takes for the pulses to return, the satellite calculates how far away the ocean is. Knowing its own height above the Earth, it can then determine the sea level at that spot. The satellite makes some adjustments for things like waves and atmospheric conditions to ensure the measurement is accurate. The satellite does this over and over to accurately measure the sea level across the planet, providing a global picture of sea level. Unlike tide gauges, satellite altimeters only measure the movement of the ocean and not the additional movement of the land next to the ocean.
Regional and Global Measurements
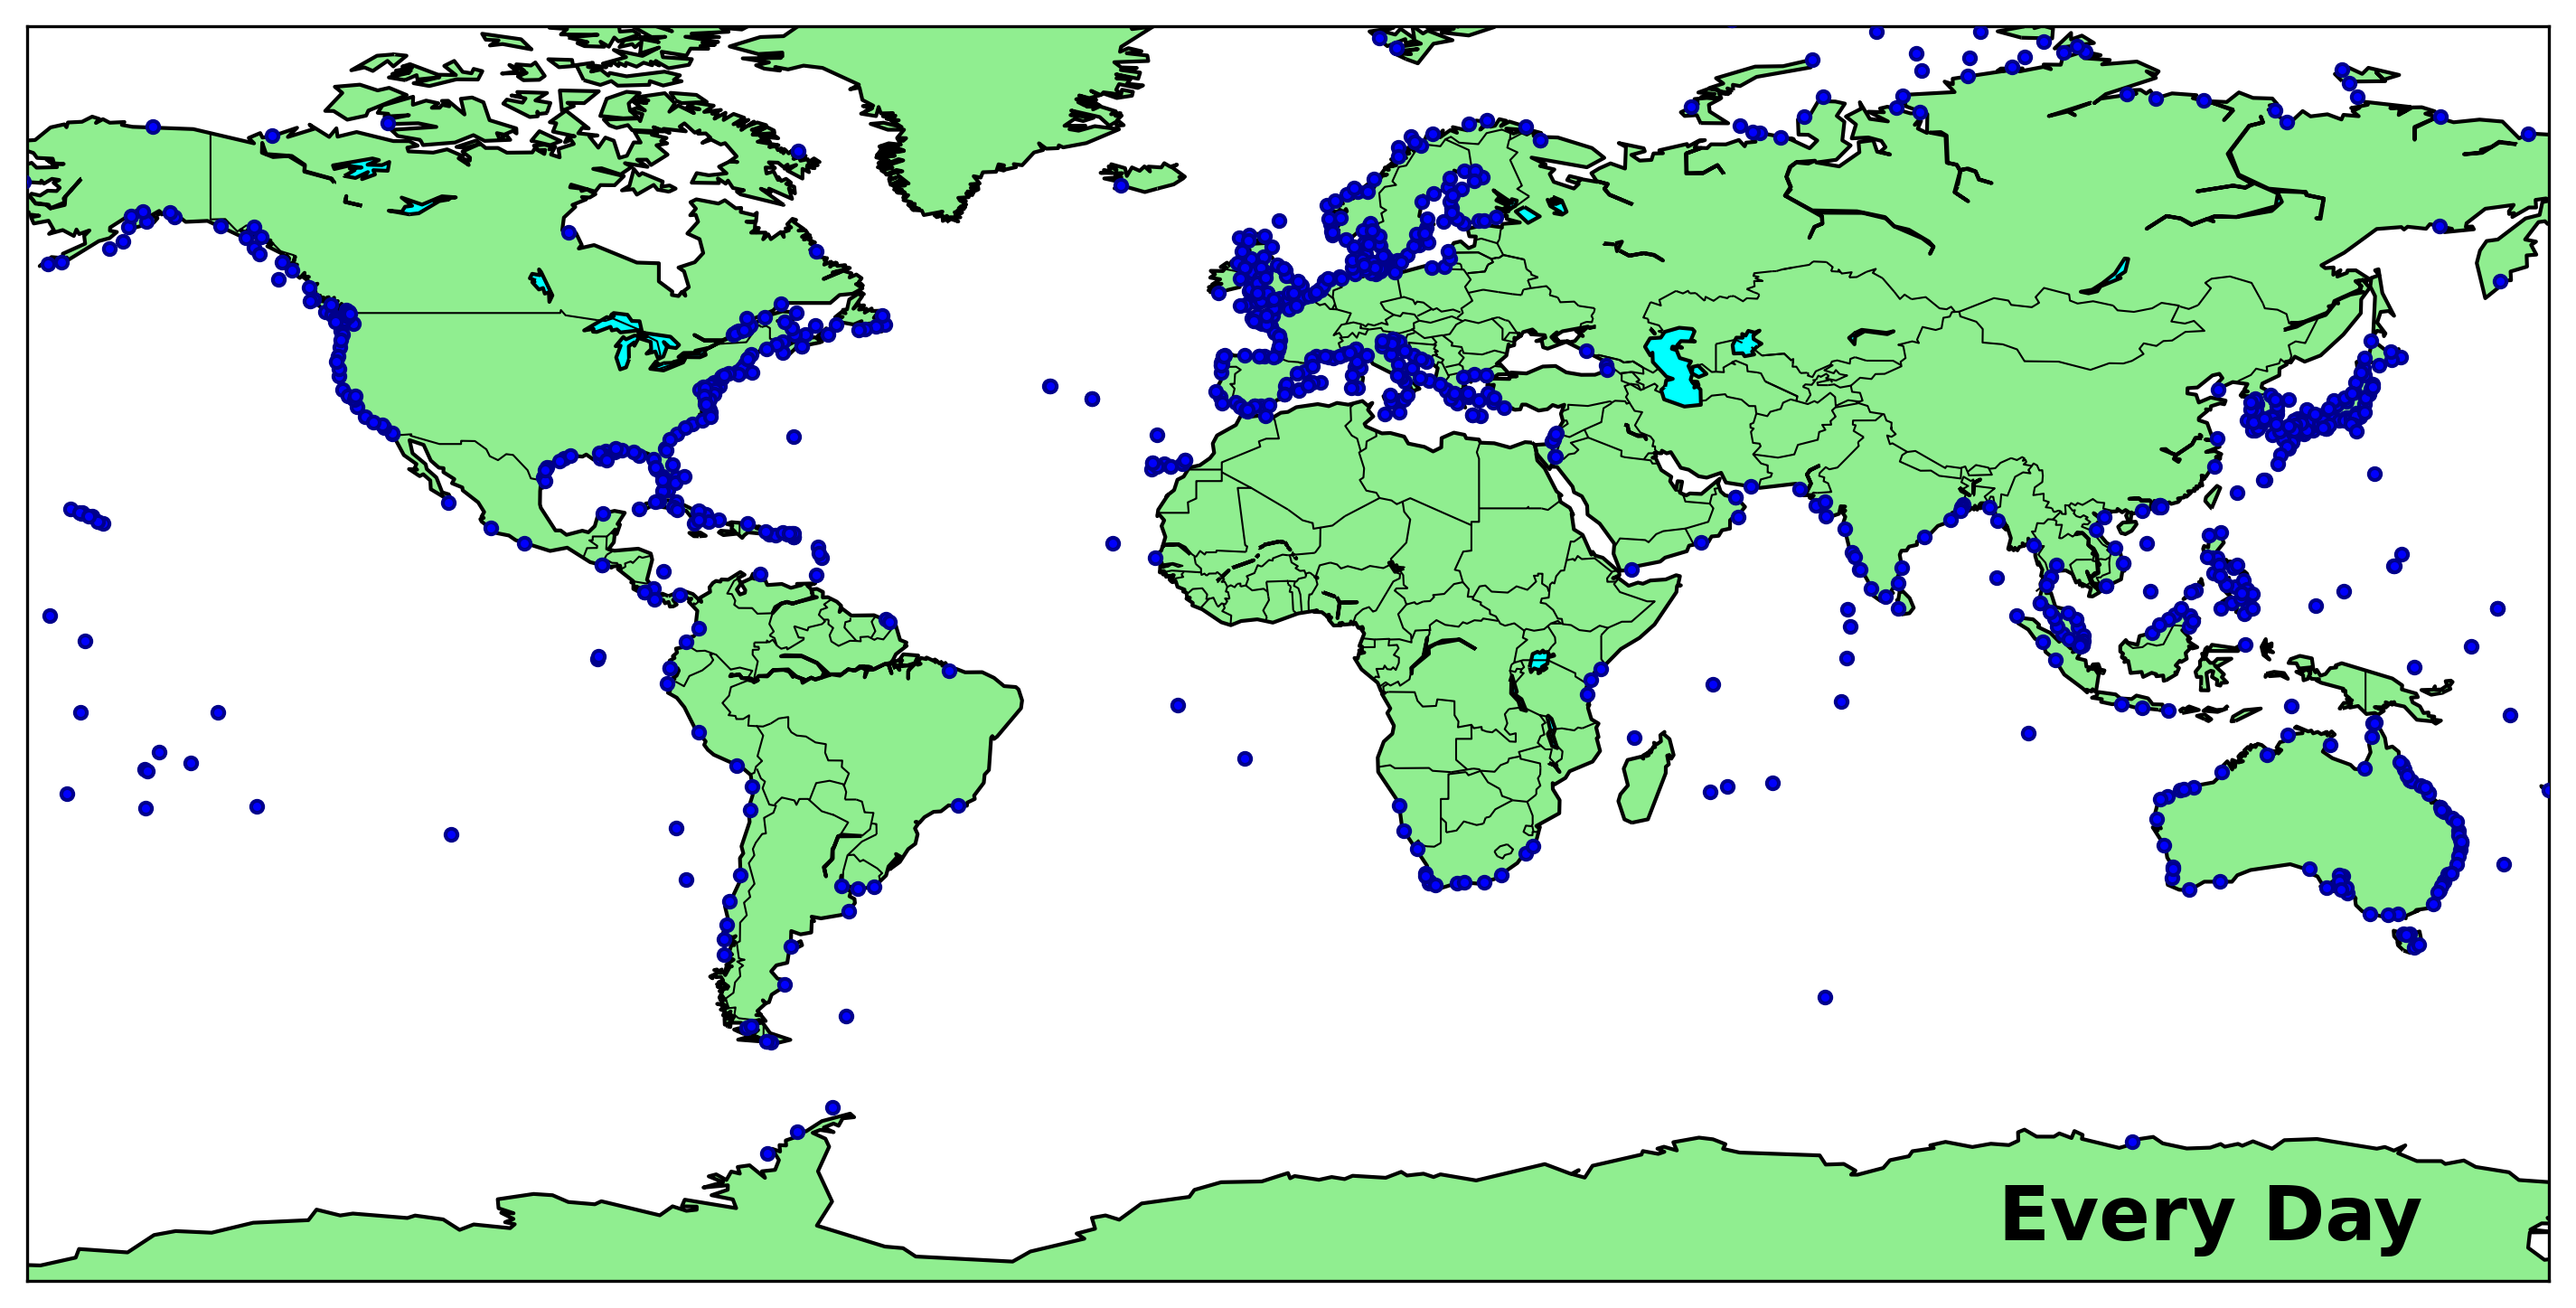
Tide gauges are located throughout the coastlines of the world, although some regions have more and some tide gauges have been around longer than others. Satellites measure all across the globe although not as frequently as a tide gauge does. Together, tide gauges and satellite altimeters tell us how sea level is changing both regionally and globally, and over periods from minutes to decades.
These measurements tell us that sea level is rising both globally and regionally. Satellites and tide gauges help scientists improve our understanding of the causes of sea level change, which then helps us understand how they might change in the future.
Sea level snippets
- Currently, there are over 2000 tide gauge stations in the Permanent Service for Mean Sea Level Revised Local Reference global dataset. Less than 20% of these are found in the Southern Hemisphere.
- From over 1000 km above Earth, satellites can measure sea levels to within an accuracy of about one inch. Over the past thirty years, the main satellites used to measure sea level have produced individual measurements from different locations once every 10 days.
Tide Gauges and Satellites: Working in Tandem
Tide gauges and satellites work together to tell us a lot about how sea level is changing along the coasts. For example, tide gauges measure relative sea level or the change in sea level experienced at a specific location, while satellites provide a measurement of absolute or geocentric sea level by referring to the changes in height of the ocean’s surface relative to the center of the Earth. By comparing the two, we can get a better understanding of where vertical land motion also known as subsidence and uplift is playing a big role in how sea levels are changing. In the image below, the sea level change from 1992 to 2023 as measured by both tide gauges and satellite altimeters is shown. In most locations, there is strong agreement, which is a good check on how well the instruments are working. In other locations, like off the southern coast of Alaska, there is a big difference between the two, as seen by the contrasting blue colored dots overtop the orange-red colored background of the ocean. Since the change in the tide gauge data is less than that in satellite altimeter data, we know that the land is rising in Alaska. In other places like the Gulf Coast of the United States, we can see that the tide gauges have measured more change, indicating that the land there is sinking.

Together, the data from tide gauges and satellites have helped us identify a long-term rise in global sea level. And, that the global rise was from human-caused climate change. Looking more closely at the data, we have found that global sea levels are rising faster in recent years. Global sea levels were rising at about 3 centimeters (1.2 inches) per decade in the early 1990s. In recent years, this has increased to about 4 centimeters (1.6 inches) per decade. This is like putting your foot down on the accelerator in a car to speed it up. That accelerating rise may not seem like a lot, but it matters for many coastal communities. Every little bit can make impacts worse.
Tracking the global and local changes to sea levels helps us more accurately estimate what will happen to sea level rise in the future.
What tools are used to measure sea level?
Measuring sea level involves a variety of instruments and methodologies. A combination of satellite and ground-based measurements is essential for accurate and comprehensive monitoring of sea level. Each instrument provides unique data that, when integrated, offer a complete view of sea level trends and the contributing factors. This multi-faceted approach enables scientists to better understand and predict the impacts of sea level rise on global and regional scales. Here’s an overview of the primary instruments used to measure sea level:
1. Tide Gauges
- Description: Tide gauges are coastal instruments that measure the change in sea level relative to a fixed point on land.
- Process: They typically consist of a stilling well and a float, or a pressure sensor that detects the water level. Modern tide gauges are often equipped with radar or acoustic sensors.
- Data Collection: Tide gauges provide continuous measurements and are vital for both measuring short-term changes and long-term sea level records, with some datasets extending over a century.
- Strengths: Provide long records with frequent sampling, and measure relative sea level change.
- Limitations: There are gaps between tide gauge records, particularly in the Global South limiting effectiveness for measuring sea level globally.
2. Satellite Altimetry

- Description: Satellite altimeters measure the distance between the satellite and the sea surface, providing global sea level data.
- Process: Satellites, such as TOPEX/Poseidon, Jason-1/2/3, and Sentinel-6, use radar altimeters to send microwave pulses to the ocean surface and measure the time it takes for the pulses to return.
- Data Collection: Satellite altimetry offers high-precision sea level measurements over the open ocean, contributing to global sea level rise assessments.
- Strengths: Makes measurements of the whole ocean with an increasingly long record and measures absolute sea level change.
- Limitations: Record has just surpassed 30 years in length and doesn't measure day-to-day changes in sea level.
3. GNSS (Global Navigation Satellite System)

- Description: GNSS stations, including GPS, are used to measure land movements which help in understanding relative sea level changes.
- Process: These stations provide precise measurements of vertical and horizontal land movements, essential for correcting tide gauge data for land subsidence or uplift.
- Data Collection: GNSS data is crucial for differentiating between absolute sea level rise and relative changes due to land movement.
- Strengths: Provides measurements of an important component of relative sea level rise.
- Limitations: Records are still very short - generally on the order of a decade - and can have geospatial gaps along coastlines.
4. GRACE and GRACE-FO Satellites

- Description: GRACE (Gravity Recovery and Climate Experiment) and GRACE Follow-On (FO) satellites measure variations in Earth's gravity field, which can be used to infer changes in sea level due to mass redistribution.
- Process: By tracking the distance between twin satellites, GRACE detects changes in gravitational pull caused by mass changes, such as melting ice sheets and changes in ocean mass.
- Data Collection: GRACE data complements other sea level measurements by providing insights into the contributions of ice melt and land water storage.
- Strengths: Provides measurements of an important component of sea level rise, monitors the melting ice sheets and glaciers, tracks the movement of water globally.
- Limitations: Record has just extended past two decades, and data only covers relatively large regions.
5. Argo Floats

- Description: Argo floats are autonomous, drifting instruments that measure temperature and salinity of the upper 2000 meters of the ocean. Some floats now reach depths beyond 2000 meters.
- Process: These floats periodically dive to specific depths and then return to the surface, transmitting their data via satellite.
- Data Collection: Argo data helps in understanding the thermal expansion component of sea level rise, which is a major factor in global sea level change.
- Strengths: Provides measurements of an important component of relative sea level rise, allows for the direct assessment of ocean warming, and has near-global coverage.
- Limitations: Records have not yet reached two decades in length and most floats do not yet reach depths beyond 2000 meters.
Adapted from Sea Level 101 on earth.gov (U.S. Sea Level Change, a coordinated effort of NASA, NOAA and partner agencies). Figures and videos are credited in their captions.